
Despite present spreads, we believe that high-yield investments may be appealing for the following reasons:
• Consider alternative valuation measures: price and yield.
• The market is composed of higher-quality companies.
• Because prices fell last year due to sharply increasing Treasury yields, further price depreciation may be limited.
• Issuer fundamentals are solid, particularly within the Energy sector.
Spreads should be considered when investing, but they should not be the sole determinant. Currently (as of 6/30), spreads are in the 400-basis point (“bp”) range, which would not meet the threshold for those waiting for wide spreads. There is a myriad of reasons why spreads may not get to those levels in the foreseeable future — one of which is the increased quality of the market. Since the high-yield market has matured and become higher quality, using historical spread levels to inform current investment decisions may be a flawed approach. There could be an opportunity cost in waiting for spreads to reach those levels. Through the first half of the year, the high-yield market gained 5.4%, on pace for a double-digit return year.
Let’s start by looking at other valuation measures — price and yield.
The average price of the high-yield market has been in the 80s all year. Looking back 20 years, the median one-year return subsequent to a price falling below 96 has been greater than 10%. Bonds below 90 have seen returns over 20%. The reason prices below par have led to such favorable outcomes is that they have math on their side. As time passes, a bond becomes closer and closer to its maturity, and in simple terms that bond can have two outcomes. It will either mature, or it will default. If a default seems unlikely, it will be “pulled to par” — meaning its price will appreciate toward par as it nears maturity. Since most bonds have not historically defaulted, discounted bond prices have led to attractive returns.
Figure 1: Discounted bond prices have led to greater returns

Source: FactSet 2/28/03 - 2/28/23. High Yield represented by ICE BofA U.S. High Yield Index. Past performance is no guarantee of future results, which will vary. It is not possible to invest directly in an index.
In fixed income, the opposite of looking at the market through a price lens is a yield lens. The yield-to-worst of high yield has remained in the 8%-9% range this year. Historically, 70% of the time when the market yield was in this range, the subsequent one-year return was greater than 10%. Another 19% of the time, the return was between 5% and 10%. Further, the market was positive in 90% of those one-year periods. A bond’s yield is its theoretical annualized return if bought at a given price and held until maturity. In practice, returns can be greater if a bond’s price appreciates to par before its maturity. Conversely, if a bond defaults, it will not realize that yield. However, since long-term default rates are in the 3.0%-3.50% range, elevated yields have proved to be attractive entry points into the asset class.
Figure 2: Higher starting yields have led to favorable outcomes

Source: FactSet 7/98 – 6/23. High Yield is represented by the ICE BofA U.S. High Yield Index. It is not possible to invest directly in an index. Past performance is not a guarantee of future results.
Getting back to spreads, it is true that investing in high yield when spreads have been wide has led to outsized returns. But it is also true that high yield has generated attractive, absolute and relative returns at other times as well. This could be one of those times, given the other valuations metrics previously discussed. There are a few reasons why spreads may not widen to levels seen during prior cycles.
First, the composition of the market. Over time, high yield has become higher quality and now about half the market is rated BB or higher. At the same time, CCCs have become a smaller weighting in the market. In the last few years, there have been many companies moving back and forth between investment grade and high yield, resulting in larger, higher-quality, and more public companies in the high-yield market. In fact, close to 70% of the high-yield market is comprised of public companies — this is relevant because public companies tend to have more transparency and greater financial flexibility. The implication is that because the high-yield market is different than it was 15 or 20 years ago, it will not command the same risk premium.
Figure 3: Large volume of bonds move between investment grade and high yield

Source: BofA Research, as of 6/30/23.
Another reason we may not see spread widening, like we have in the past, is last year’s rate move. Treasury yields increased dramatically leading to losses across fixed income. This pulled forward the potential price impact that would otherwise occur from spread widening. Beginning in 1998 up through the end of 2021, the average spread when prices were between 80 and 90 was 738 bps, significantly wider than current levels. The yellow star in the scatterplot below represents the current price and spread. This suggests that spreads can only widen so much before pushing the prices of otherwise high-quality companies down to distressed levels or recovery values.
Figure 4: Current price levels historically were reflective of wider spreads

Source: FactSet 7/98 – 12/21. High Yield is represented by the ICE BofA U.S. High Yield Index. It is not possible to invest directly in an index. Past performance is not a guarantee of future results.
Of course, the last argument only holds true if there is not a massive default wave — and fundamentals do support this being the case. In 2020-2021, there was a large volume of refinancing activity — issuers took advantage of low interest rates to term out their debt, pushing maturities out farther into the future and locking in lower costs of capital. This has resulted in record interest coverage ratios — an important fundamental metric that compares an issuer’s cash flow to its level of debt service. High interest coverage ratios mean a company has a greater ability to pay its debt obligations.
Figure 5: Energy companies have fundamental strength

Source: BofA, as of 6/30/23.
Most notably, the largest sector in the market, Energy’s interest coverage has dramatically increased to 10.8x, more than double that of the market, according to BofA Research. This research also shows that energy companies have been responsible with their balance sheets and have a leverage ratio of just 1.4x, considerably lower than the market average of 3.5x.
Figure 6: The energy sector is higher quality than the market

Source: FactSet, as of 6/30/23. High yield represented by ICE BofA U.S. High Yield Index; High Yield Energy represented by ICE BofA U.S. High Yield Energy Index The option-adjusted spread (OAS) is the measurement of the spread of a fixed income security rate and the risk-free rate of return, which is adjusted to take into account an embedded option. Past performance is no guarantee of future results, which will vary. It is not possible to invest directly in an index.
Given those fundamentals, it should not come as a surprise that the Energy sector is higher quality than the overall market. Energy has almost 59% in BBs compared with 49% for the market and less than half of the market’s CCC weighting. Perhaps the best predictor of defaults is level of distress. 8.4% of the high-yield market has an average spread of over 800 bps, whereas only 1.4% of Energy has a spread wider than 800 bps.
Figure 7: Wider energy spreads have historically preceded market spread widening
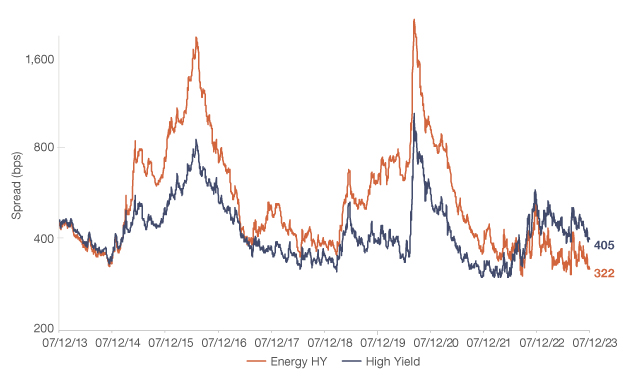
Source: FactSet 7/12/13-7/12/23. High yield represented by ICE BofA U.S. High Yield Index; High Yield Energy represented by ICE BofA U.S. High Yield Energy Index Spread represented by option adjusted spread (OAS). Past performance is no guarantee of future results, which will vary. It is not possible to invest directly in an index.
This matters not only because Energy is the largest sector in the market, but also because recent spread widening periods have been led by Energy. Energy spreads have typically been wider than the market, but this trend has reversed in the last year, and Energy is now approximately 80 bps tighter than the market. Even before COVID-19 when market spreads were in the 300s, Energy spreads surpassed 700 bps. For these reasons, it is less likely that Energy will drive market spreads wider in the near to medium term.
So high yield appears to be in a good place — the market is comprised of higher quality; mostly public companies and fundamentals are on solid footing. Energy issuers are well positioned given the strength of their balance sheets. At the same time, prices are at levels typically observed in crises due to rate moves, which could potentially limit further price depreciation. Therefore, spreads very well may remain resilient and not reach levels seen in prior credit events. With prices still at an attractive discount and issuer fundamentals demonstrating resiliency, the high yield fallacy of high yield and spreads could chase investors away from an otherwise appealing opportunity.
Definitions
Fallen Angel is a bond that was initially given an investment-grade rating but has since been reduced to junk bond status.
ICE BofA U.S. High Yield Index tracks the performance of U.S. dollar-denominated, below-investment-grade corporate debt publicly issued in the U.S. domestic market.
ICE BofA High Yield Energy Index tracks the performance of high-yield bonds issued by companies operating in the energy sector.
Rising Star is a bond that is rated as a junk bond but could become investment grade because of improvements in the issuing company’s credit quality.
Yield to worst is computed by using the lower of either the yield to maturity or the yield to call on every possible call date.
About risk
Past performance is no guarantee of future results, which will vary. All investments are subject to market risk and will fluctuate in value.
Investing in below-investment-grade securities may carry a greater risk of nonpayment of interest or principal than higher-rated bonds. These securities can also be subject to greater price volatility.
This material represents an assessment of the market environment as of a specific date; is subject to change; and is not intended to be a forecast of future events or a guarantee of future results. This information should not be relied upon by the reader as research or investment advice regarding the funds or any issuer or security in particular. This material contains general information only and does not take into account an individual’s financial circumstances. This information should not be relied upon as a primary basis for an investment decision. Rather, an assessment should be made as to whether the information is appropriate in individual circumstances and consideration should be given to talking to a financial advisor before making an investment decision.
By subscribing you are consenting to receive personalized online advertisements from New York Life Investments.