After a rocky 2020, REITs started to run in ‘21: US REITs trounced the S&P by ~13% while Global REITs beat the MSCI World by ~5%.1 In 2022 and beyond, a confluence of tailwinds should support the real estate asset class, propel performance and enable active managers to go the distance:
— Macro: broad economic growth is moderating, inflation is high, and interest rates are rising. Headwinds for some, REITs outperform with this mix: rising rents offset both inflation and higher interest rates. Active managers can further amplify REIT pricing power for investors.
— Momentum: REIT earnings and dividends are accelerating just as global earnings are slowing. REIT cashflow will outpace broad equities in 2022 and 2023; active managers who see revisions coming can outpace the asset class still further.
— Money Flow: When REIT flows turn positive, they tend to stay positive; when the stocks outperform broad indices, they keep going. Those managers with strong track records stand to benefit and compound returns for their investors.
— M&A: An enduring wave of capital is lifting net asset values across the sector and deal activity is accelerating. Managers adept at uncovering attractive assets can better serve investors.
1 US REITs represented by the FTSE NAREIT Equity REITs Index; Global REITs represented by the FTSE EPRA NAREIT Developed Index.
Figure 1: The Real Estate Setup for 2022 and 2023
Factor: Macro: Moderating Growth, High Inflation, Rising Interest Rates
Fact: REITs outperform in these environments. Rising rents offset rising rates, and durable growth leads to outperformance vs. global equities during economic moderation
Furthermore: Active managers can augment pricing power in inflation-protected portfolios
Factor: Momentum Earnings
Fact: REIT fundamentals are accelerating while global markets are slowing
Furthermore: Active managers can position in equities before earnings estimates change
Factor: Money Flow
Fact: REIT outperformance and fund flows tend to persist over time
Furthermore: Active managers with strong track records can compound investor returns
Factor: M&A
Fact: 2021 deal activity dwarfed 2020 deal activity by 10x--and momentum continues
Furthermore: Integrated public-private managers can uncover the undervalued assets that M&A rewards
Source: CBRE Investment Management. Please see disclosures to Figures 2-7 for more information.

Rising Rents: A Match for Moderating Macro, Higher Interest Rates, and Higher Inflation
When we look into 2022, we see many of the headwinds facing global markets—moderating growth, rising interest rates, higher inflation—as tailwinds for real estate. Taking global growth first, broader economic activity is moderating; global GDP, industrial orders, and consumer confidence are healthy, but unlikely to improve at a faster rate in 2022 than they did in 2021. During periods of moderating growth, real estate tends to outperform, as persistent pricing and durable investment trends support the group. We examine REIT’s history of outperformance in Figure 2: they have delivered 23%+ annualized returns during moderating environments, with US REITs leading the S&P by ~8%.
Figure 2: REITs Outperform Amidst Moderating Economies
Moderating Economic Growth Tends to Lead to Real Estate Stock Outperformance
U.S. economic cycle indicator*
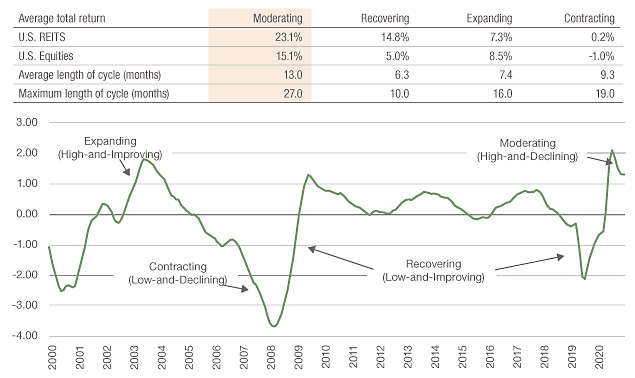
*The US Economic Cycle Indicator is calculated using the year-on-year change in the Conference Board’s Leading Economic Index (LEI), normalizing its history using a z-score, and tracking the 3-month moving average of that z-score. The Economic Cycle is determined by both the level and the change in the indicator, requiring two months in the same cycle in order to confirm a new cycle.
Source: CBRE Investment Management, MSCI U.S. REIT Index, and S&P 500 Index as of 12/31/2021. Conference Board Leading Economic Index (LEI) as if 11/30/2021. Information is the opinion of CBRE Investment Management, which is subject to change and is not intended to be a guarantee of future results or investment advice. Forecasts are not indicative of future investment performance.
When it comes to interest rates, a rising interest rate cycle might frighten REIT investors—until they again remember rising rents. As seen in Figure 3 below, REITs have performed well after the start of a hiking cycle—in part due to their natural pricing power and pro-cyclical tendencies:
Figure 3: REITs Can Take a Hike
Average U.S. REIT Returns Before and After an Initial Rate Hike
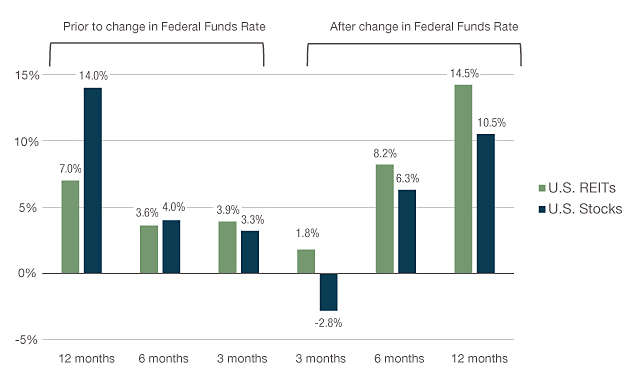
CBRE Investment Management FTSE Nareit Equity REIT Index, S&P 500 Index, U.S. Federal Funds Target rate as of 12/31/2021. Represents an average of returns from the prior four rate hike cycles starting 6 months prior to the first hike. Past performance is no guarantee of future results.
When it comes to higher inflation, REITs have that covered; not only do the assets outperform broad equities
during periods of higher inflation, by 7-9%2, but the dividend growth of REITs has delivered above CPI. We show this in Figure 4.
2 Compares annualized US REIT performance compared to the S&P during periods of above-average and rising and above-average and falling inflation.
Figure 4: REIT Performance and Dividends Knock Out Inflation
Average Annualized REIT Performance
U.S. REITs vs. U.S. Equities During Inflation Regimes
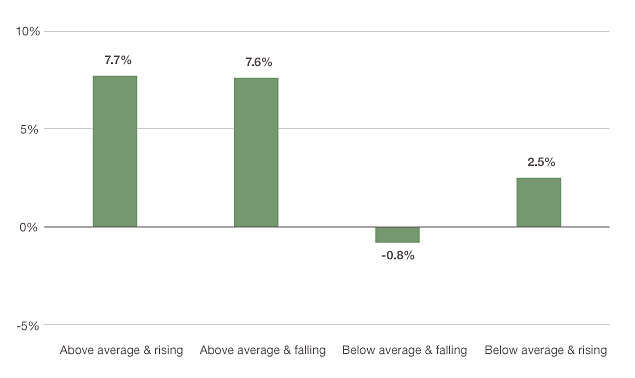
Source: CBRE Investment Management, FTSE Nareit All Equity REIT Index and S&P 500 Index as of 12/31/2021. Trailing 20-years based on average monthly total returns during inflation regimes, annualized. Inflation Regimes calculated using the year-on-year change in the U.S. CPI, normalizing its history using a z-score, and tracking the 3-month moving average of that z-score. The Inflation Regime is determined by both the level and the change in the indicator, requiring two months in the same cycle in order to confirm a new regime. Information is the opinion of CBRE Investment Management, which is subject to change and is not intended to be a forecast of future events, a guarantee of future results, or investment advice. Forecasts and any factors discussed are not a guarantee of future results.
U.S. REIT dividend growth per share vs. Consumer Price Index
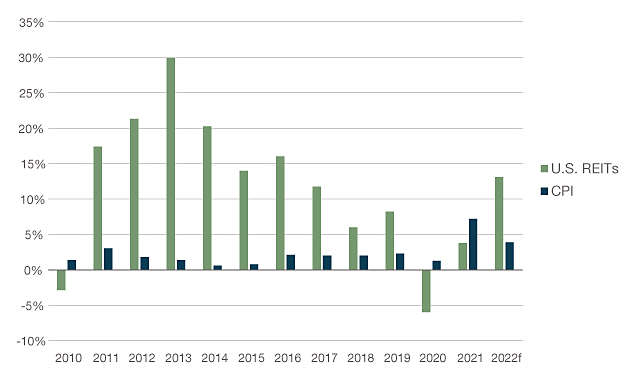
Source: CBRE Investment Management as of 12/31/2021. U.S. Real Estate: FTSE Nareit Equity REIT Index and CBRE Investment Management, Consumer Price Index. “f” represents forecasts. An index is unmanaged and not available for direct investment. Past performance is no guarantee of future results.
Rising Up to the Challenge: REIT Earnings and Dividends Outpace Rivals
Looking into 2022, REITs present a differentiated growth profile for today’s investors. Broader equity earnings are moderating, but REIT earnings (and dividends) are accelerating. In Figure 5, we examine the comparative earnings of REITs vs. the market: REITs are strengthening into 2022 and 2023.
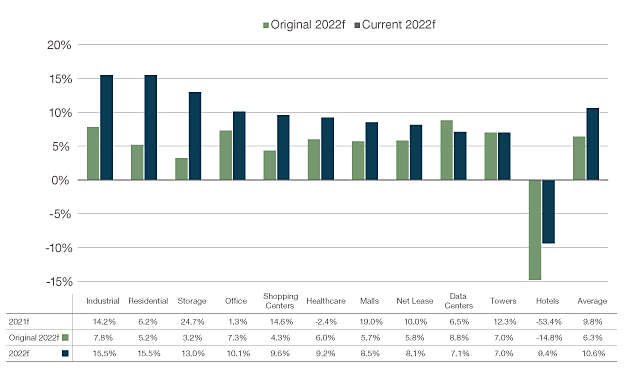
This strength is broad based, as earnings are improving and exceeding expectations across the majority of REIT subsectors. We detail this in Figure 6.
Figure 5: REITs Are Outgrowing Equities
U.S. Equities Earnings Growth on Left.
U.S. REITs Earnings Growth on Right.
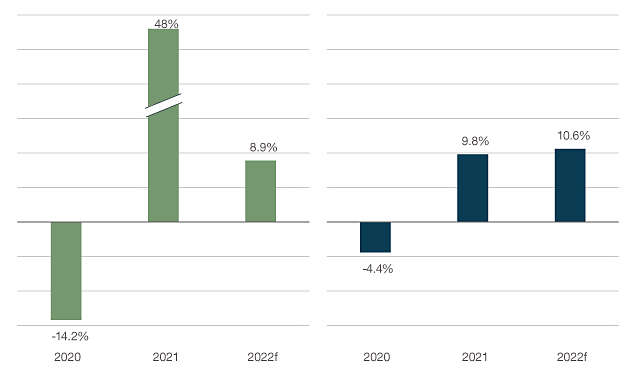
Figure 5 sources: CBRE Investment Management as of 12/31/2021. “f” represents forecasts. U.S. Real Estate: FTSE Nareit Equity REIT Index, U.S. Equity: S&P 500 Index. An index is unmanaged and not available for direct investment. Past performance is no guarantee of future results.
Figure 6: REIT Sector Earnings Growth
U.S. Real Estate Earnings Growth Forecast by Sector
Source: CBRE Investment Management as of 12/31/2021. “F” refers to “forecasts.” 2021 and 2022 forecasts for the U.S. hotel sector are represented by 2021/2019 and 2022/2019 CAGR. The U.S. average does not include the 2021 and 2022 growth rates for the U.S. hotel sector due to the negative hotel growth in 2020 as a result of the pandemic. Forecasts are the opinion of CBRE Investment Management, which is subject to change and is not intended to be a guarantee of future results or investment advice. Forecasts are not indicative of future investment performance.
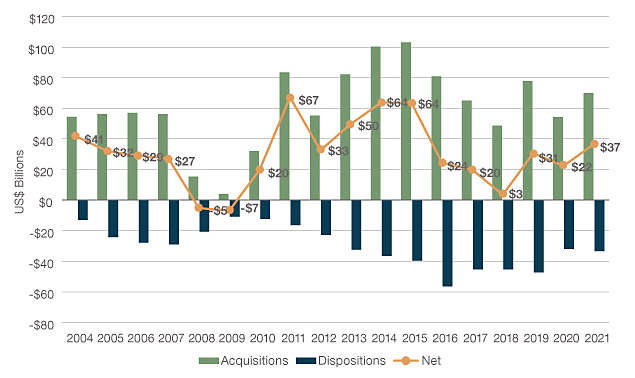
Earnings momentum for REITs is augmented by their strong financial shape, and ability to deploy capital in an accretive manner; today, the asset class collectively has one of the strongest post-recession balance sheets in the modern REIT era. 2021 has seen the highest sector net acquisition activity in a decade, which has amplified REITs’ underlying earnings power.
Figure 7: REITs Acquisition Activity Highest in a Decade—Augmenting Growth
Source: CBRE Investment Management and FTSE Nareit Equity REIT Index through Q3 3021 earnings. Information is the opinion of CBRE Investment Management, which is subject to change and is not intended to be a forecast of future events, a guarantee of future results, or investment advice. Forecasts and any factors discussed are not a guarantee of future results.
REITs Returns (and Funds Flow) Often Defend the Title
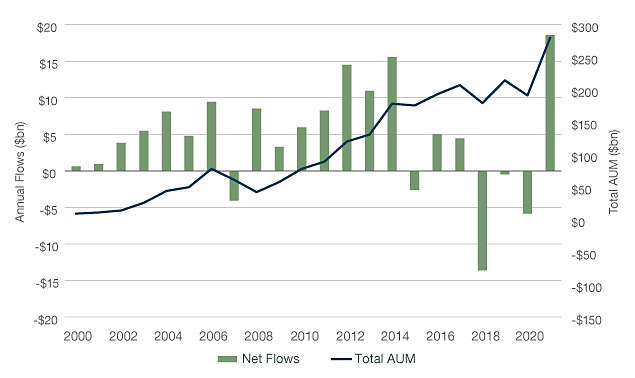
Some investors see the returns of REITs in 2021 (~41%/27% between US and global REITs) and question their sustainability. Have they missed the boat? History suggests that returns are repeatable. REITs tend to keep going after recessions; after 2001 and 2008-2009, they outperformed not only in the immediate recovery period, but also in ensuing years. REITs have also demonstrated considerable momentum in fund flows, as we show in Figure 8:
Figure 8: REIT Fund Flows Tend to Have Momentum
Source: Morningstar Direct including Global Real Estate and Real Estate Fund Categories as of 12/31/2021.
The Take-Out: M&A a Tailwind for Listed Equities and Equity Managers
2021 has seen a marked increase in M&A, not just for the entire market but also for real estate. 2021 real estate deal flow grew 10x over 2020 levels. Deal flow has reinforced our view that certain sectors trade at an undeserved discount to private market values (NAV) and that listed real estate provides valuable exposure to scaled platforms such as data centers and storage, for which the private market will pay dearly. Active managers with an information edge and a fundamental process can ultimately capitalize on M&A; M&A tends to reward the undervalued businesses with positive fundamentals that active managers target as a matter of course.
Figure 9: Historical REIT M&A Volume by $Bn
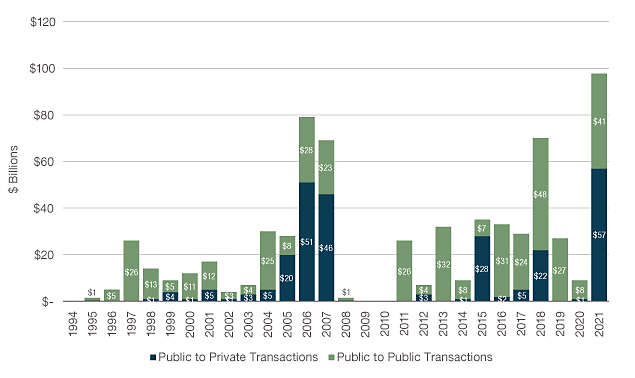
Source: CBRE Investment Management as of 12/31/2021. For illustrative purposes only. Not intended to provide current market analysis. Information is the opinion of CBRE Investment Management, which is subject to change and is not intended to be a forecast of future events, a guarantee of future results, or investment advice. Forecasts and any factors discussed are not a guarantee of future results.
At the Opening Bell
With 2021 behind and 2022 ahead, we see continued momentum for the REIT asset class, with multiple tailwinds to aid performance and enable active managers to outperform. The rising rents of real estate—which overpower economic moderation, higher inflation, and higher interest rates—can surge in a portfolio in which managers overweight high margin sectors with an ability to reprice. Compared to broad equities, REITs offer compelling and attractive earnings growth—which managers can amplify. REITs’ enduring money flow, and the sector’s historical performance out of recessions, can compound alongside manager alpha, while shrewd managers can invest in the types of companies that M&A rewards. For 2022 and beyond, REITs are rising up—and active managers are ready to go the distance for today’s investors.
About CBRE Investment Management
CBRE Investment Management is a leading global real assets investment management firm with $133.1 billion in assets under management* as of September 30, 2021, operating in more than 30 offices and 20 countries around the world. Through its investor-operator culture, the firm seeks to deliver sustainable investment solutions across real assets categories, geographies, risk profiles and execution formats so that its clients, people and communities thrive.
CBRE Investment Management is an independently operated affiliate of CBRE Group, Inc. (NYSE:CBRE), the world’s largest commercial real estate services and investment firm (based on 2020 revenue). CBRE has more than 100,000 employees serving clients in more than 100 countries. CBRE Investment Management harnesses CBRE’s data and market insights, investment sourcing and other resources for the benefit of its clients. For more information, please visit www.cbreim.com.
If you would like to discuss the contents of this paper with our real estate team, or would like more information about investing in real estate, please contact:
Brian Kinsella
Vice President | Marketing & Client Service C: +1 610 995 8934
Jon Treitel, CFA, CAIA
Portfolio Strategist
T: +1 917 837 5525
Dividends fluctuate and are subject to change. There is no guarantee they will continue to be paid. While dividends may cushion returns in down markets, investments are still subject to loss of principal amount invested.
Investing involves risk, including possible loss of principal. Asset allocation and diversification may not protect against market risk, loss of principal, or volatility of returns. There is no guarantee that these investment strategies will work under all market conditions or are suitable for all investors, and each investor should evaluate their ability to invest long-term, especially during periods of downturn in the market. No representation is being made that any account, product, or strategy will or is likely to achieve profits. This material has been prepared for informational purposes only, and is not intended to provide, and should not be relied on for, accounting, legal or tax advice. Your clients should consult your tax or legal advisor regarding such matters. This material is not intended to be relied upon as a forecast, research or investment advice, and is not a recommendation, offer or solicitation to buy or sell any securities or to adopt any investment strategy.
*Assets under management (AUM) refers to the assets under management, fair market value of real assets-related investments with respect to which CBRE Investment Management provides, on a global basis, oversight, investment management services and other advice and which generally consist of investments in real assets; equity in funds and joint ventures; securities portfolios; operating companies and real assets-related loans. This AUM is intended principally to reflect the extent of CBRE Investment Management’s presence in the global real assets market, and its calculation of AUM may differ from the calculations ofother asset managers and from its calculation of regulatory assets under management for purposes of certain regulatory filings.
This material is intended for informational purposes only, does not constitute investment advice, or a recommendation, or an offer or solicitation, and is not the basis for any contract to purchase or sell any security, property or other Instrument, or for CBRE Investment Management to enter into or arrange any type of transaction. This information is the sole property of CBRE Investment Management and its affiliates. Acceptance and/or use of any of the information contained in this document indicates the recipient’s agreement not to disclose any of the information contained herein.
Certain economic and market information contained herein has been obtained from published sources prepared by third parties and in certain cases has not been updated through the date hereof. Neither CBRE Investment Management, any fund or program or its general partner, nor their respective affiliates nor any of their respective employees or agents assume any responsibility for the accuracy or completeness of such information.
CBRE Investment Management has not made any representation or warranty, express or implied, with respect to the fairness, correctness, accuracy, reasonableness or completeness of any of the information contained herein (including but not limited to information obtained from third parties), and they expressly disclaim any responsibility or liability therefore. CBRE Investment Management does not have any responsibility to update or correct any of the information provided in this presentation.
Information referenced for the CBRE strategy is from the MainStay CBRE Real Estate Fund.
1928290
By subscribing you are consenting to receive personalized online advertisements from New York Life Investments.
