If nothing else, the last two years have shown us the importance of diversification. Expectations of Fed rate policy decisions have been everchanging. The 10 US Treasury yield touched 5% for the first time since 2007. It is important to build a diversified portfolio that can perform well across a range of outcomes, and not rely solely on one particular outcome. Positioning a portfolio for interest rate exposure with a long duration was rewarded in 2020 when rates plummeted but was quite costly in subsequent years when rates rose.
One way of diversifying traditional fixed income exposure is through a strategic allocation to floating rate loans. Floating rate loans are a compelling addition to portfolios because they act as a hedge against fixed coupon bonds, reducing interest rate risk while generating high levels of income. Their coupons have two components - a fixed spread and a floating rate reference rate, which is closely tied to Fed Funds. Because of this, some investors try to time the asset class, entering when rate hikes are set to commence and exiting before the Fed pauses. Of course, timing markets and making bets on macroeconomic trends is very difficult. In our view, this approach has led to the asset class being underutilized over the past 12-18 months, overexposing portfolios to rate risk and underexposing them to credit.
Loan mutual funds saw massive inflows in 2021 as US Treasury yields began to rise with the pandemic recovery, putting price pressure on longer duration bond. The tide turned in 2022 and loan funds began experiencing redemptions as investors anticipated a “Fed pivot” along with economic concerns. Despite waning enthusiasm for loans, the asset class proved to be resilient in 2022, declining just 77 bps compared to high yield, investment grade corporates and the Bloomberg Aggregate Index which were all down double digits. The outperformance continued this year and through 10/31, loans are up 10.14% year to date, drastically outperforming other areas of fixed income.
Floating Rate Loans were relatively resilient in an extremely challenging 2022
Floating Rate Loans are outperforming other areas of fixed income
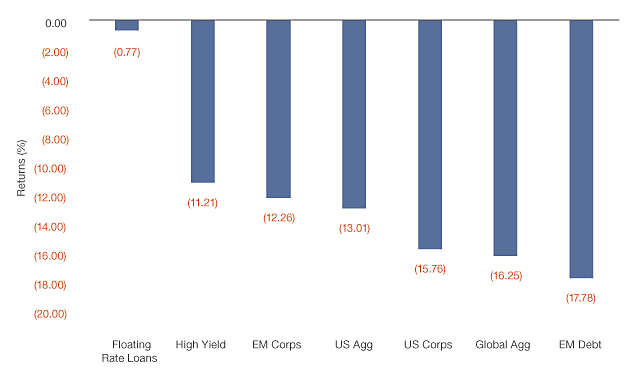
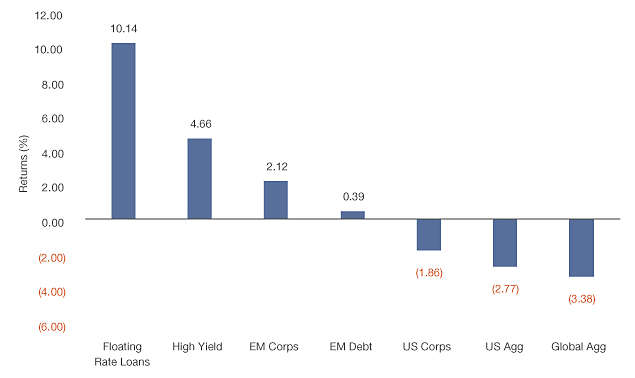
Source: Morningstar. YTD returns as of 9/30/23. Floating Rate Loans represented by Morningstar LSTA US LL Index TR USD. High Yield represented by ICE BofA US HY Constnd TR USD. EM Corps represented by JPM CEMBI Broad Diversified TR USD. EM Debt represented by JPM EMBI Global Diversified TR USD. US Corps represented by Bloomberg US Corp Bond TR USD. US Agg represented by Bloomberg US Agg Bond TR USD. Global Agg represented by Bloomberg Global Aggregate TR USD. An investment cannot be made directly into an index. Past performance is not a guarantee of future results.
Historically, when the Fed is hiking rates, floating rate loan coupons increase and at the same time, longer duration bonds can struggle if Treasury yields are also increasing. On the other hand, when the Fed has cut rates, longer duration bonds have outperformed floating rate loans. Less obvious is that over the last 30 years, floating rate loans have outperformed core bonds while the Fed has been on hold. The below chart shows rolling 1-year periods based upon Fed policy since 1992, and we found that on average, loans outperformed core bonds both when the Fed has been on hold and when they were hiking rates. With expectations of “higher for longer”, there is a case to be made for investing in floating rate loans.
Loans outperformed core bonds during Fed pauses
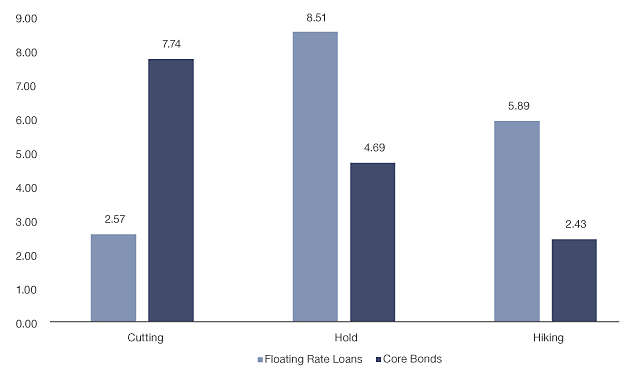
Source: FactSet, Morningstar. Average 1 year rolling returns 1/31/1992 - 9/30/2023. Floating Rate Loans represented by the Credit Suisse Leveraged Loan Index. Core bonds represented by the Bloomberg Barclays US Aggregate Bond Index. Loosening represents 1-year periods in which the Fed Funds Target Rate was lowered. Tightening represents periods in which the Fed Funds Target Rate increased. An investment cannot be made directly into an index. Past performance is not a guarantee of future results.
Since the summer of 2022, the loan market has outperformed core bonds by almost 1800 bps. This is noteworthy because that is when floating rate loan outflows were accelerating as strategists were starting to recommend adding duration. This is a case in point demonstrating how hard it can be to time rates and the penalty for being incorrect. Having an allocation to both strategies would put performance in between and alleviate the need to make the correct bet.
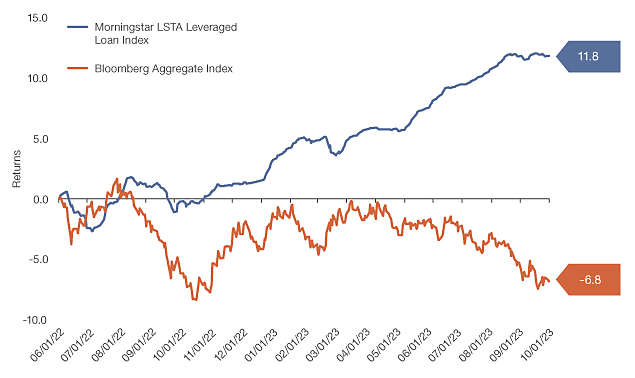
Source: FactSet 6/1/22 - 9/14/23. An investment cannot be made directly into an index. Past performance is not a guarantee of future results.
Another reason to make loans a strategic position is a portfolio is that historically the asset class has generated fairly consistent returns. There is a misconception by some that they have been “burned” by floating -rate loans in the past, but. besides the financial crisis, there were two down years, both less than 1%. Conversely, there have been four years with returns greater than 10%.
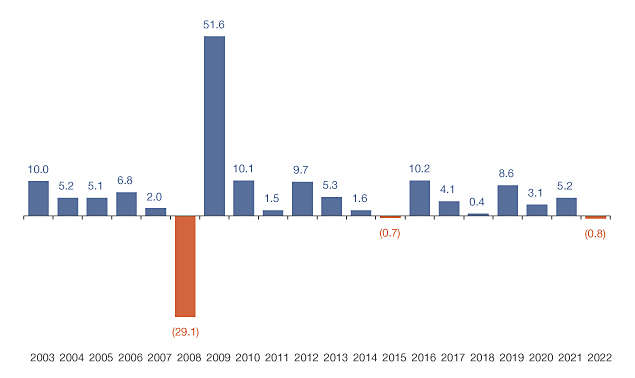
Source: FactSet, 2003-2022. Loans represented by the Morningstar LSTA Leveraged Loan Index. It is not possible to invest directly in an index. Past performance is not a guarantee of future results.
Pairing floating -rate Loans and Bonds
When it comes to high yield bonds and floating rate loans, it doesn’t have to be an “either or” decision. The markets have become increasingly distinct over time. As the loan market has grown to be approximately the same size as the high yield market, there is less overlap between issuers. High yield issuers tend to be larger companies with a higher percentage of publicly traded companies whereas the loan market tends to have a greater proportion of private companies. Looking below at sector weightings, high yield has significantly higher weights to energy and gaming/lodging. On the other hand, the loan market has greater exposure to technology, healthcare, and services, the top three sectors in the market .
Top 5 HY Sectors by Weighs
Top 5 Loan Sectors by Weight
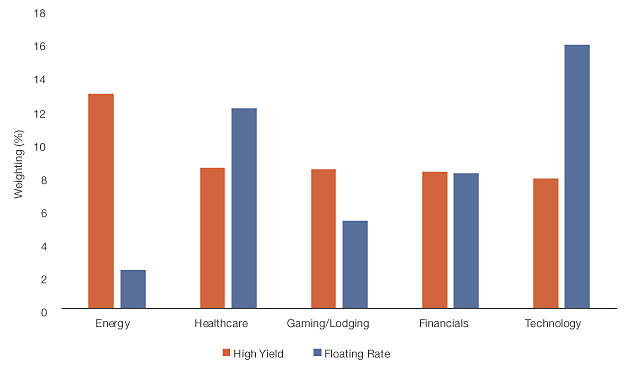
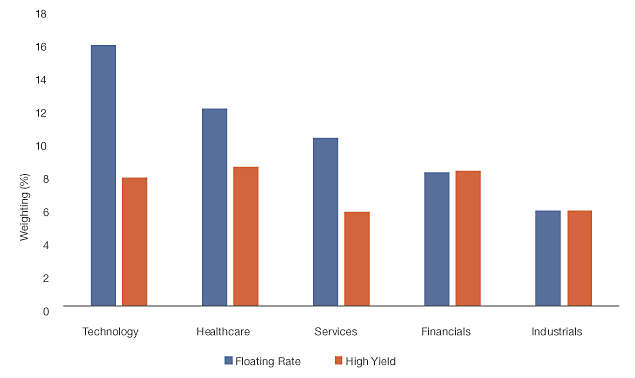
Source: J.P. Morgan 8/31/23. High Yield is represented by ICE BofA U.S. High Yield Constrained Index and Floating Rate is represented by Morningstar LSTA U.S. Leveraged Loan Index. An investment cannot be made directly into an index. Past performance is not a guarantee of future results.
When making the case for floating-rate loans, it is more of a question of “why always” rather than “why now.” Timing entry and exit points in investing has proven to be extraordinarily difficult, especially being able to do so on a consistent basis. A key tenet of investing has always been diversification, and this has never been more important than in the recent past when there have been so many potential outcomes, given broad uncertainty — monetary policy, fiscal policy, inflation, geopolitical events, etc. These past 12-18 months have shown that treating the asset class as a tactical trade can have an high opportunity cost. It’s time to think of floating-rate loans as a strategic allocation.
Definitions
Standard deviation is a statistic that measures the dispersion of a dataset relative to its mean and is calculated as the square root of the variance.
The Sharpe ratio divides a portfolio's excess returns by a measure of its volatility to assess risk-adjusted performance.
Duration is a measure of the sensitivity of a fixed-income investment, such as a bond or a bond portfolio, to changes in interest rates.
Index Definitions
The Morningstar LSTA US Leveraged Loan Index is designed to deliver comprehensive, precise coverage of the US leveraged loan market.
The ICE BofA U.S. High Yield Index is an unmanaged index that tracks the performance of U.S. dollar denominated, below investment-grade rated corporate debt publicly issued in the U.S. domestic market.
The J.P. Morgan CEMBI Broad Diversified Core Index (CEMBI CORE) tracks the performance of US dollar-denominated bonds issued by emerging market corporate entities.
The J.P. Morgan ESG EMBI Global Diversified Index (JESG EMBIG) tracks liquid, US Dollar emerging market fixed and floating-rate debt instruments issued by sovereign and quasi-sovereign entities.
The Bloomberg Barclays US Corporate Bond Index measures the investment grade, fixed-rate, taxable corporate bond market.
The Bloomberg US Aggregate Bond Index, or the Agg, is a broad base, market capitalization-weighted bond market index representing intermediate term investment grade bonds traded in the United States.
The Bloomberg Global Aggregate Bond Index (USD Hedged) represents a close estimation of the performance that can be achieved by hedging the currency exposure of its parent index, the Bloomberg Global Aggregate Bond Index, to USD.
About Risk
Past performance is no guarantee of future results, which will vary. All investments are subject to market risk and will fluctuate in value.
Treasury Securities are backed by the full faith and credit of the United States government as to payment of principal and interest if held to maturity. Interest income on these securities is exempt from state and local taxes.
Bonds are subject to interest-rate risk and can lose principal value when interest rates rise. Bonds are also subject to credit risk, in which the bond issuer may fail to pay interest and principal in a timely manner, or that negative perception of the issuer's ability to make such payments may cause the price of that bond to decline.
Floating rate funds are generally considered to have speculative characteristics that involve default risk of principal and interest, collateral impairment, non-diversification, borrower industry concentration, and limited liquidity.
Investing in below-investment-grade securities may carry a greater risk of nonpayment of interest or principal than higher-rated bonds. These securities can also be subject to greater price volatility. Diversification cannot assure a profit or protect against loss in a declining market.
Important Disclosures
This material contains the opinions of its authors but not necessarily those of New York Life Investments or its affiliates. It is distributed for informational purposes only and is not intended to constitute the giving of advice or the making of any recommendation to purchase a product. The opinions expressed herein are subject to change without notice. The investments or strategies presented are not appropriate for every investor and do not take into account the investment objectives or financial needs of particular investors.
This material represents an assessment of the market environment as at a specific date, is subject to change, and is not intended to be a forecast of future events or a guarantee of future results. This information should not be relied upon by the reader as research or investment advice regarding any funds or any particular issuer/ security. The strategies discussed are strictly for illustrative and educational purposes and are not a recommendation, offer or solicitation to buy or sell any securities or to adopt any investment strategy. There is no guarantee that any strategies discussed will be effective.
Any forward-looking statements are based on a number of assumptions concerning future events, and although we believe the sources used are reliable, the information contained in these materials has not been independently verified, and Its accuracy is not guaranteed. In addition, there is no guarantee that market expectations will be achieved.
New York Life Investments and its affiliates do not provide tax advice. You should obtain advice specific to your circumstances from your own legal, accounting, and tax advisors.
This material contains general information only and does not take into account an individual’s financial circumstances. This information should not be relied upon as a primary basis for an investment decision. Rather, an assessment should be made as to whether the information is appropriate in individual circumstances and consideration should be given to talking to a financial professional before making an investment decision.
“New York Life Investments” is both a service mark, and the common trade name, of certain investment advisors affiliated with New York Life Insurance Company. Securities are distributed by NYLIFE Distributors LLC, 30 Hudson Street, Jersey City, NJ 07302, a wholly owned subsidiary of New York Life Insurance Company. NYLIFE Distributors LLC is a Member FINRA/SIPC.
6080324
By subscribing you are consenting to receive personalized online advertisements from New York Life Investments.
1. As measured by the ICE BofA Broad US Taxable Municipal Securities Index and the Bloomberg Global Aggregate Corporates Index.
2. Moody’s Trends in Global Corporates Rating Transitions, Moody’s US Municipal Bond Defaults and Recoveries as of October 18, 2023
3. Source: Bloomberg
IMPORTANT DISCLOSURE
Availability of this document and products and services provided by MacKay Shields LLC, MacKay Shields UK LLP and MacKay Shields Europe Investment Management Limited (collectively, “MacKay Shields”) may be limited by applicable laws and regulations in certain jurisdictions and this document is provided only for persons to whom this document and the products and services of MacKay Shields may otherwise lawfully be issued or made available. None of the products and services provided by MacKay Shields are offered to any person in any jurisdiction where such offering would be contrary to local law or regulation. This document is provided for information purposes only. It does not constitute investment advice and should not be construed as an offer to buy securities. The contents of this document have not been reviewed by any regulatory authority in any jurisdiction.
This material contains the opinions of certain professionals at MacKay Shields but not necessarily those of MacKay Shields LLC. The opinions expressed herein are subject to change without notice. This material is distributed for informational purposes only. Forecasts, estimates, and opinions contained herein should not be considered as investment advice or a recommendation of any particular security, strategy or investment product. Information contained herein has been obtained from sources believed to be reliable, but not guaranteed. Any forward-looking statements speak only as of the date they are made and MacKay Shields assumes no duty and does not undertake to update forward-looking statements. No part of this document may be reproduced in any form, or referred to in any other publication, without express written permission of MacKay Shields LLC. © 2023, MacKay Shields LLC. All Rights Reserved. Past performance is not indicative of future results.
COMPARISONS TO AN INDEX
Comparisons to a financial index are provided for illustrative purposes only. Comparisons to an index are subject to limitations because portfolio holdings, volatility and other portfolio characteristics may differ materially from the index. Unlike an index, portfolios are actively managed and may also include derivatives. There is no guarantee that any of the securities in an index are contained in any managed portfolio. The performance of an index may assume reinvestment of dividends and income, or follow other index-specific methodologies and criteria, but does not reflect the impact of fees, applicable taxes or trading costs which, unlike an index, may reduce the returns of a managed portfolio. Investors cannot invest in an index. Because of these differences, the performance of an index should not be relied upon as an accurate measure of comparison.
SOURCE INFORMATION
Source: ICE Data Indices, LLC (“ICE Data”), is used with permission. ICE® is a registered trademark of ICE Data or its affiliates, and BofA® is a registered trademark of Bank of America Corporation licensed by Bank of America Corporation and its affiliates (“BofA”) and may not be used without BofA’s prior written approval. ICE Data, its affiliates and their respective third party suppliers disclaim any and all warranties and representations, express and/or implied, including any warranties of merchantability or fitness for a particular purpose or use, including the indices, index data and any data included in, related to, or derived therefrom. Neither ICE Data, its affiliates nor their respective third party suppliers shall be subject to any damages or liability with respect to the adequacy, accuracy, timeliness or completeness of the indices or the index data or any component thereof, and the indices and index data and all components thereof are provided on an “as is” basis and your use is at your own risk. Ice data, its affiliates and their respective third party suppliers do not sponsor, endorse, or recommend MacKay shields LLC, or any of its products or services.
“Bloomberg®”, “Bloomberg Indices®”, Bloomberg Fixed Income Indices, Bloomberg Equity Indices and all other Bloomberg indices referenced herein are service marks of Bloomberg Finance L.P. and its affiliates, including Bloomberg Index Services Limited (“BISL”), the administrator of the indices (collectively, “Bloomberg”) and have been licensed for use for certain purposes by MacKay Shields LLC (“MacKay Shields”). Bloomberg is not affiliated with MacKay Shields, and Bloomberg does not approve, endorse, review, or recommend MacKay Shields or any products, funds or services described herein. Bloomberg does not guarantee the timeliness, accurateness, or completeness of any data or information relating to MacKay Shields or any products, funds or services described herein.
THE FOLLOWING INDICES MAY BE REFERENCED IN THIS DOCUMENT:
Bloomberg U.S. Aggregate Bond Index: The Bloomberg U.S. Aggregate Index represents securities that are SEC-registered, taxable, and dollar denominated. Must have at least one year to final maturity regardless of call features. Must have at least $300 million par amount outstanding. Must be rated investment-grade (Baa3/BBB- or higher) by at least two of the following ratings agencies: Moody's, S&P, Fitch. Must be dollar-denominated and non-convertible.
Bloomberg Global Aggregate Corporate Index: Bloomberg Global Aggregate Corporate Index is a flagship measure of global investment grade, fixed-rate corporate debt. This multi-currency benchmark includes bonds from developed and emerging markets issuers within the industrial, utility and financial sectors. You cannot invest directly in an index.
ICE BofA Broad U.S. Taxable Municipal Securities Index: ICE BofA Broad U.S. Taxable Municipal Securities Index tracks the performance of U.S. dollar denominated debt publicly issued by U.S. states and territories, and their political subdivisions, in the U.S. domestic market. Qualifying securities must be subject to U.S. federal taxes and must have at least 18 months to maturity at point of issuance, at least one year remaining term to final maturity to enter the index and one month remaining term to final maturity to remain in the index, a 2 fixed coupon schedule (including zero coupon bonds) and an investment grade rating (based on an average of Moody’s, S&P and Fitch). The call date on which a pre-refunded bond will be redeemed is used for purposes of determining qualification with respect to final maturity requirements. Minimum size requirements vary based on the initial term to final maturity at time of issuance. Securities with an initial term to final maturity greater than or equal to one year and less than five years must have a current amount outstanding of at least $10 million. Securities with an initial term to final maturity greater than or equal to five years and less than ten years must have a current amount outstanding of at least $15 million. Securities with an initial term to final maturity of ten years or more must have a current amount outstanding of at least $25 million. “Direct pay” Build America Bonds (i.e., a direct federal subsidy is paid to the issuer) qualify for inclusion in the index, but “tax-credit” Build America Bonds (i.e., where the investor receives a tax credit on the interest payments) do not. Local bonds issued by U.S. territories within their jurisdictions that are tax exempt within the U.S. territory but not elsewhere are excluded from the Index. All 144a securities, both with and without registration rights, and securities in legal default are excluded from the Index. Index constituents are market capitalization weighted. Accrued interest is calculated assuming next-day settlement. Cash flows from bond payments that are received during the month are retained in the index until the end of the month and then are removed as part of the rebalancing. Cash does not earn any reinvestment income while it is held in the index.
ABOUT RISK
Municipal bond risks include the ability of the issuer to repay the obligation, the relative lack of information about certain issuers, and the possibility of future tax and legislative changes, which could affect the market for and value of municipal securities. Bonds subject to interest rate risk and can lose principal value when interest rates rise. Bonds are also subject to credit risk which is the possibility that the bond issuer may fail to pay interest and principal in a timely manner. Diversification cannot assure a profit or protect against loss in a declining market.
“New York Life Investments” is both a service mark, and the common trade name, of certain investment advisors affiliated with New York Life Insurance Company.
