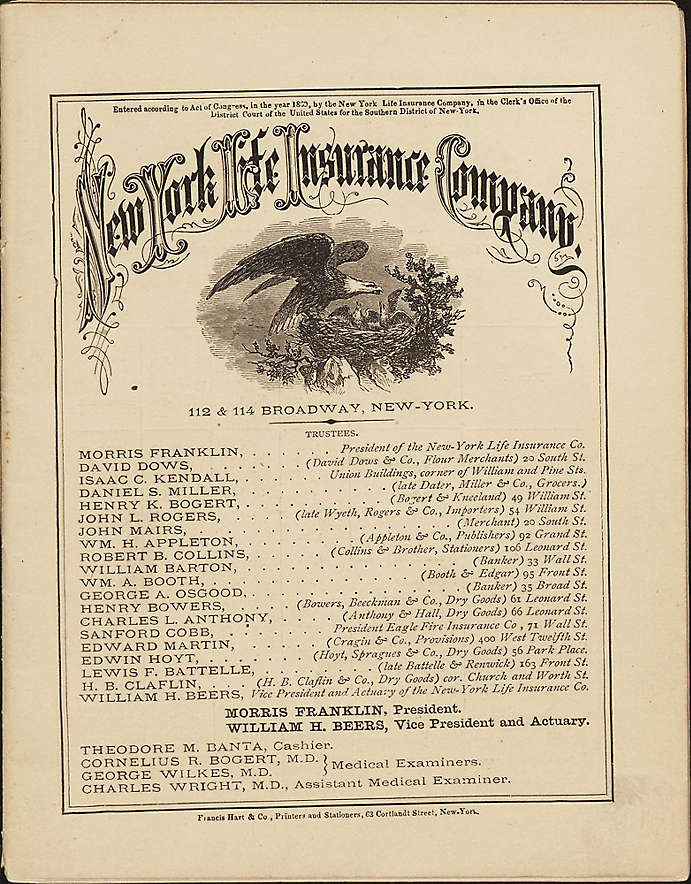
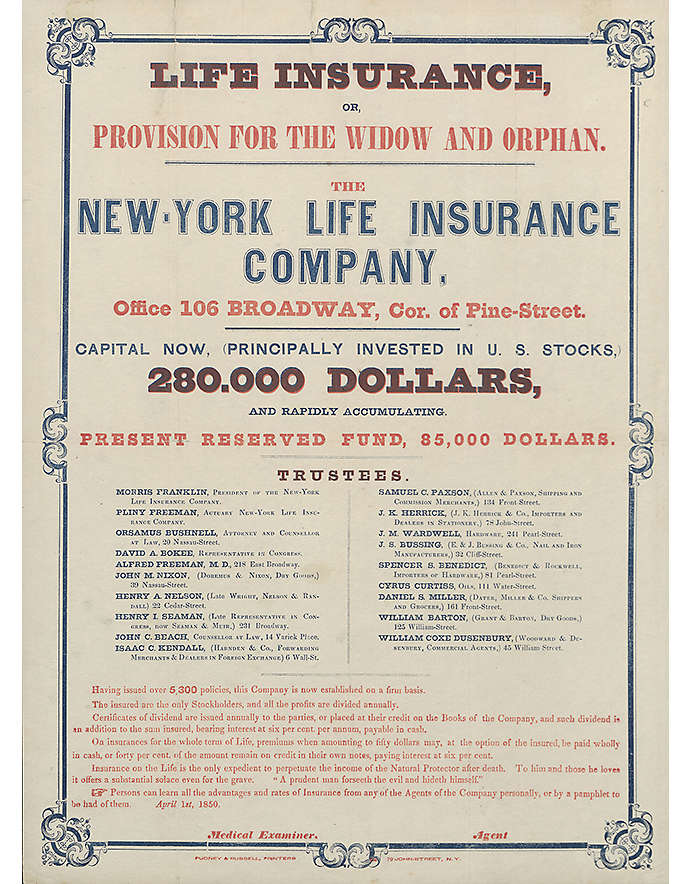
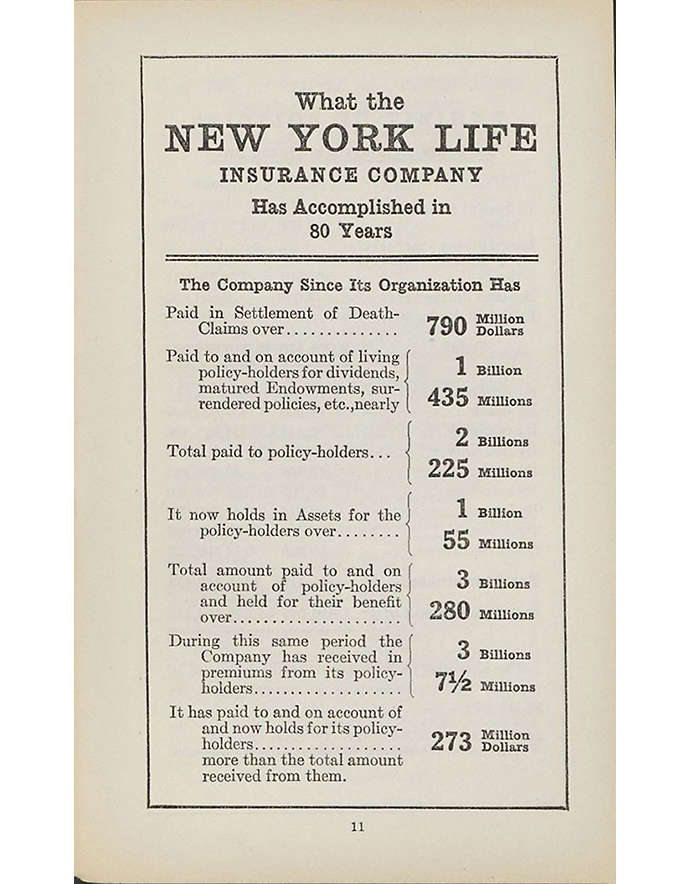
We’ve experienced a lot over time. But one constant remains: our commitment to clients.
New York Life Investments is comprised of the affiliated global asset management businesses of our parent company, New York Life Insurance Company (New York Life). One of the largest and oldest mutual life insurance companies in the United States, New York Life has the highest credit ratings for financial strength currently awarded to any life insurer by the four major ratings agencies (including a AAA rating¹), and has consistently paid annual dividends to our policyholders since 18542.
-
1845
Nautilus Insurance Co. founded.
-
1849
New York Life renamed New York Life Insurance Co.
-
1856
Company assets surpass $1 million.
-
1923
Company assets surpass $1 billion.
-
1952
Sells first annuity marking entry into the pension market.
-
1968
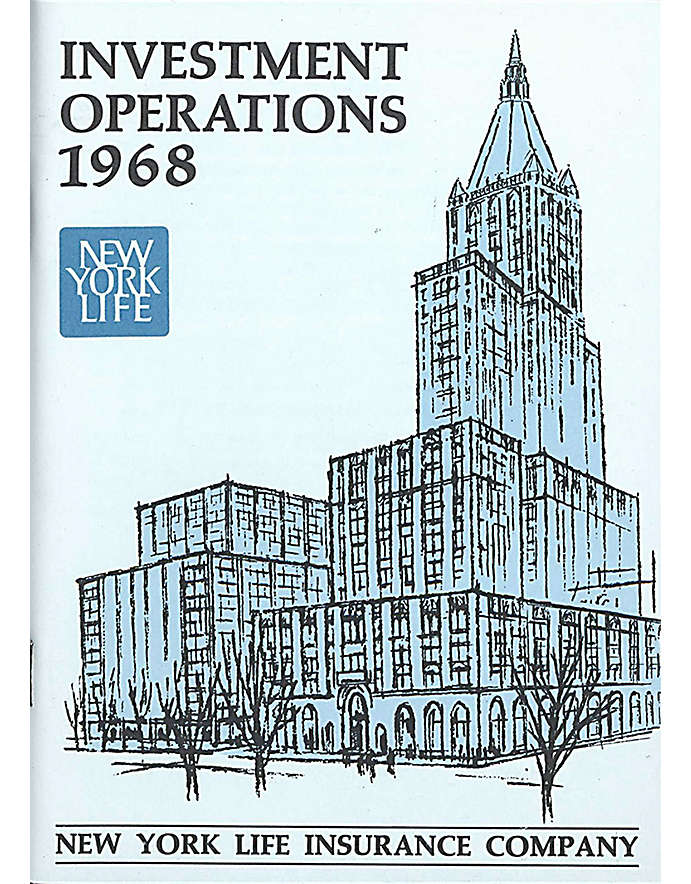
Company assets surpass $10 billion.
-
1980
Introduction of our first Guaranteed Investment Contract (GIC) marking a shift in focus to active investment management rather than playing a largely administrative role.
-
1984
Purchase of blue-chip money manager MacKay Shields heralding our entrance into the business of independent active management of equity and fixed income.
-
1986
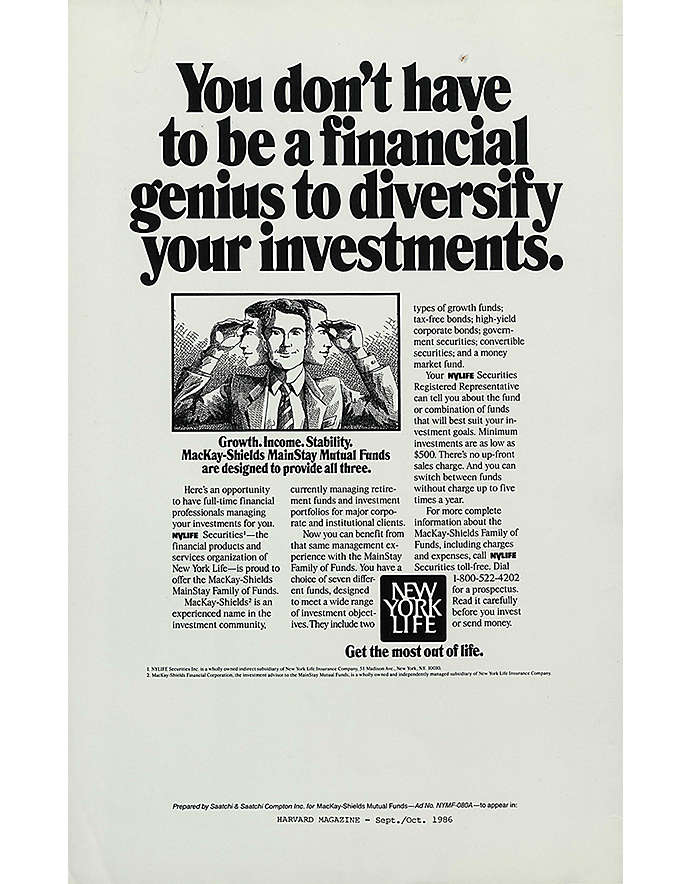
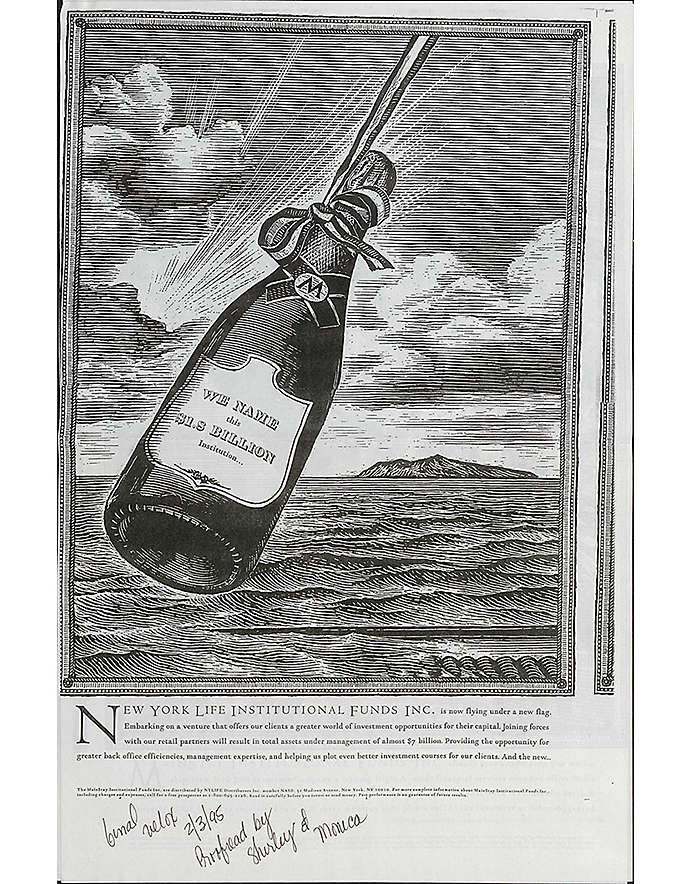
Founding of the MainStay fund family, sold by both our agency force and third-party advisors to retail investors.
-
1990
Company assets surpass $50 billion.
-
1991
MainStay begins offering institutional mutual funds making us the first insurance company to offer them.
-
1994
MainStay retail funds surpass $5 billion, and MainStay institutional funds approach $2 billion.
-
1999
Founding of GoldPoint Partners, a premier private equity manager.
-
2000
New York Life Investment Management LLC (NYLIM) is created to provide institutional and retail clients with a diverse offering of fixed-income, equity and alternative products and solutions under one roof.
-
2001
Founding of Madison Capital Funding, a direct lender to private equity-backed middle-market companies.
-
2002
New York Life becomes the largest mutual life insurance company in America.
-
2010
New York Life initiates a strategic focus on growing its investments business to help offset low interest rates—the company has $287 billion in assets under management.
-
2010
Acquisition of U.S.-based alternative investment boutique, PA Capital, formerly known as Private Advisors.
-
2013
NYLIM opens South Korea office.
-
2014
Company assets under management surpass $540 billion.
-
2014
Acquisition of Europe-based boutique, CANDRIAM (previously named Dexia Asset Management), a pioneer in sustainable and responsible investing. Ausbil, an Australian-based investment manager, was also part of this acquisition.
-
2015
Acquisition of IndexIQ, a leading provider of institutional and liquid alternatives exchange traded funds (ETFs).
-
2016
NYLIM opens Japan office.
-
2017
Company assets under management surpass $555 billion.
-
2018
CANDRIAM announces strategic partnership with Tristan Capital Partners, a premier European real estate manager.
-
2019
MainStay Funds is named in Barron's annual ranking of active mutual fund managers, "Best Fund Families of 2018." ³
-
2020
New York Life celebrates its 175th Anniversary.
-
2021
MainStay Funds named a top 10 mutual fund family for 2021 by Barron’s, based on relative performance for the 2021 calendar year among 51 qualifying fund families for the Best Fund Family Category.⁴
-
2022
GoldPoint Partners, PA Capital, and Madison Capital Funding combined to form Apogem Capital, unlocking value across the middle market for both clients and sponsors.
1. Source: Individual independent rating agency commentary as of 10/15/2020: A.M. Best (A++), Fitch (AAA), Moody’s Investors Service (Aaa), Standard & Poor’s (AA+). Dividends are not guaranteed. The financial strength of New York Life Insurance Company applies only to its insurance products and not to investment products, which are subject to market risk and fluctuation in value.
2. Founded in October 2013, as a result of a corporate restructuring, NYL Investors LLC carries on certain of the investment advisory activities previously conducted by (NYLIM). Prior to the formation of NYL Investors, its investment divisions operated as part of NYLIM, which is an indirect wholly-owned subsidiary of New York Life Insurance Company.
3. Source: Barron’s, 3/8/19. Overall, MainStay Funds ranked number 2 for the one-year period, 21 for the five-year period, and 31 for the 10-year period ended December 31, 2018, out of 57 fund families. Past performance is no guarantee of future results, which will vary.
4. How Barron’s Ranks the Fund Families: All mutual and exchange-traded funds are required to report their returns (to regulators as well as in advertising and marketing material) after fees are deducted, to better reflect what investors would actually experience. But our aim is to measure manager skill, independent of expenses beyond annual management fees. That’s why we calculate returns before any 12b-1 fees are deducted. Similarly, fund loads, or sales charges, aren’t included in our calculation of returns.
Each fund’s performance is measured against all of the other funds in its Refinitiv Lipper category, with a percentile ranking of 100 being the highest and one the lowest. This result is then weighted by asset size, relative to the fund family’s other assets in its general classification. If a family’s biggest funds do well, that boosts its overall ranking; poor performance in its biggest funds hurts a firm’s ranking.
To be included in the ranking, a firm must have at least three funds in the general equity category, one world equity, one mixed equity (such as a balanced or target-date fund), two taxable bond funds, and one national tax-exempt bond fund.
Single-sector and country equity funds are factored into the rankings as general equity. We exclude all passive index funds, including pure index, enhanced index, and index-based, but include actively managed ETFs and so-called smart-beta ETFs, which are passively managed but created from active strategies.
Finally, the score is multiplied by the weighting of its general classification, as determined by the entire Lipper universe of funds. The category weightings for the one-year results in 2021 were general equity, 37.1%; mixed asset, 20.6%; world equity, 16.8%; taxable bond, 20.9%; and tax-exempt bond, 4.5%.
The category weightings for the five-year results were general equity, 37.3%; mixed asset, 21%; world equity, 16.5%; taxable bond, 20.8%; and tax-exempt bond, 4.4%. For the 10-year list, they were general equity, 38.6%; mixed asset, 19.2%; world equity, 16.9%; taxable bond, 20.5%; and tax-exempt bond, 4.8%
The scoring: Say a fund in the general U.S. equity category has $500 million in assets, accounting for half of the firm’s assets in that category, and its performance lands it in the 75th percentile for the category. The first calculation would be 75 times 0.5, which comes to 37.5. That score is then multiplied by 37.1%, general equity’s overall weighting in Lipper’s universe. So it would be 37.5 times 0.371, which equals 13.9. Similar calculations are done for each fund in our study. Then the numbers are added for each category and overall. The shop with the highest total score wins. The same process is repeated to determine the five- and 10-year rankings.
Source: Barron’s, 2/21/22. Overall, MainStay Funds ranked number 9 for the one-year period, 25 for the five-year period, and 31 for the 10-year period ended December 31, 2021, out of 51, 49, and 45 fund families, respectively. Past performance is no guarantee of future results, which will vary. For the most recent MainStay Funds performance, please visit our web site at newyorklifeinvestments.com.
The S&P 500 Index measures the performance of 500 widely held stocks in US equity market. Standard and Poor's chooses member companies for the index based on market size, liquidity and industry group representation. Included are the stocks of industrial, financial, utility, and transportation companies. Since mid 1989, this composition has been more flexible and the number of issues in each sector has varied. It is market capitalization-weighted.


