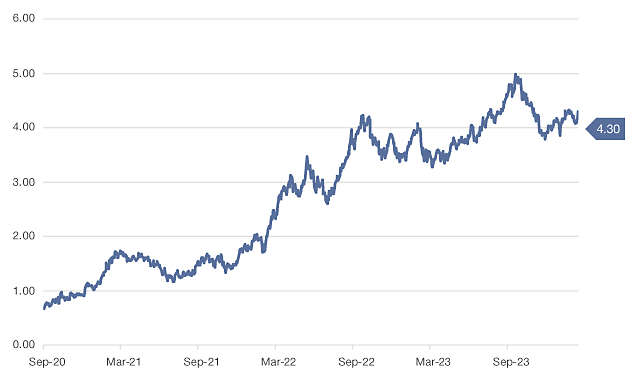
The decision to extend duration or stay short has proven to be quite difficult over the past few years. The 10-year Treasury yield seemed to have peaked numerous times, only to bounce back sharply and surpass the previous peak. This led to heightened volatility in more rate-sensitive asset classes like core bonds, which were almost down for the second consecutive year in 2023 but found reprieve in a fourth-quarter rates rally.
Figure 1: 10 Year Treasury Yield

Source: FactSet 9/30/2020 – 3/14/2024. Past performance is no guarantee of future results, which will vary.
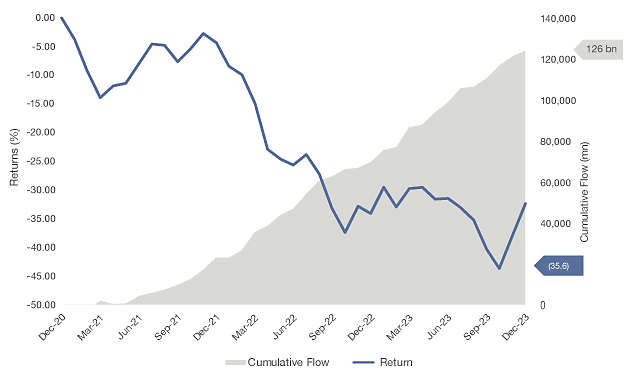
Despite the upward trajectory of U.S. Treasuries, investors poured money into longer-duration fixed income, confident that rates would soon fall. In 2023, Intermediate Core Bond, Long Government and Intermediate Core Plus Bond were the top three fixed-income Morningstar category flow leaders. On the other hand, Short-Term Bond and Bank Loans, categories with very limited duration, were the top two fixed-income category outflow leaders.
However, after a fall in Treasury yields late last year, they resumed their upward trajectory in 2024, putting pressure on fixed-income prices. The chart below shows cumulative fund flows into the Morningstar Long Government category versus the performance of long government bonds since 2021.This chart demonstrates how difficult it can be to time markets — and the penalty for being wrong. While long-duration funds and ETFs saw massive inflows, long government bonds have declined almost 36% during that same period.
Figure 2: Flows Poured into Long Duration While Bonds Sold-Off

Source: FactSet, Morningstar 9/30/2020 – 9/30/2023. Flows are represented by the Morningstar Long Government category. Performance represented by the Bloomberg US Treasury (20+) Index. Past performance is no guarantee of future results, which will vary. It is not possible to invest directly in an index.
This highlights the importance of diversification in fixed income — with so many different potential outcomes, portfolios should be positioned so they are not dependent on one specific outcome to perform well. We believe implementing a “credit/duration” barbell consisting of short-duration, non-investment-grade credit and longer duration, investment-grade bonds can achieve that necessary diversification.
For our example, we use a 50/50 blend of short-duration, high-yield and floating-rate loans to represent the credit component and core bonds for the high-quality duration component. Short-duration credit is more sensitive to corporate fundamentals, and given that floating-rate loan coupons are tied to the fed funds rate, this allocation has generated relatively high levels of income, while offering total return potential due to discounted prices. Historically, when credit experienced volatility, this coincided with falling rates, which had a positive impact on longer-duration, high-quality bonds. Pairing these uncorrelated segments of fixed income together has the potential to provide attractive, risk-adjusted returns.
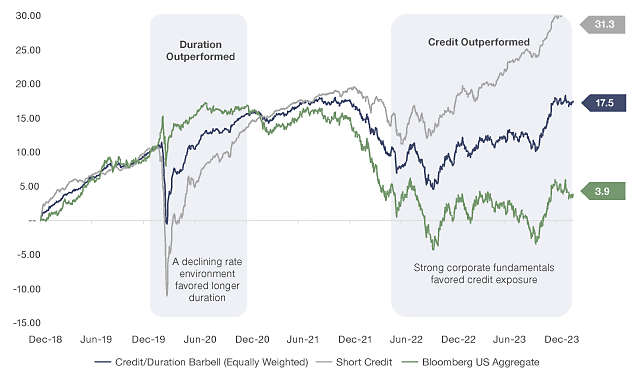
An investor’s economic view and risk tolerance would determine how the barbell is weighted. Over the last five years, favoring credit has outperformed a more rate-sensitive barbell. However, the 100% credit portfolio had the deepest drawdown in 2020. A barbell tilted toward credit has the potential for high levels of income and total returns. If the economy is weaker than anticipated, high-quality duration can buffer credit volatility. On the other hand, an investor who wants to lengthen duration and is more cautious on credit may tilt the allocation toward higher-quality, longer-duration bonds, while maintaining some credit exposure, which may enhance returns if rates don’t fall.
Figure 3: Credit/Duration Barbell

Source: FactSet, 9/30/2018 – 3/14/24. Short Credit is represented by an equal weighted blend of ICE BofA US High Yield BB-B (1-5Y) and Morningstar LSTA Leveraged Loan Index. The Bloomberg U.S. Aggregate Bond Index is a broad-based benchmark that measures the Investment Grade, U.S. dollar-denominated, fixed-rate taxable bond market. It is not possible to invest directly in an index. Past performance does not guarantee future results.
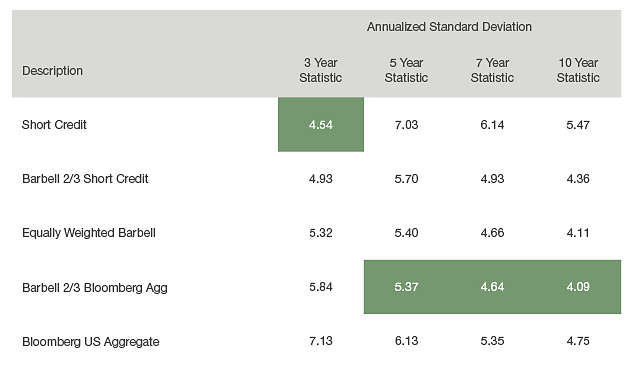
Most notably, the 100% Bloomberg US Aggregate portfolio has not had the lowest volatility (as measured by standard deviation) over the past five years, or other time periods for that matter. Adding short-duration credit to a core bond allocation has historically reduced portfolio risk — even just a one-third weighting to credit has significantly reduced risk.

Source: FactSet. As of 3/15/24. Standard deviation is a statistic that measures the dispersion of a dataset relative to its mean and is calculated as the square root of the variance. Short Credit is represented by an equal weighted blend of ICE BofA US High Yield BB-B (1-5Y) and Morningstar LSTA Leveraged Loan Index. The Bloomberg U.S. Aggregate Bond Index is a broad-based benchmark that measures the investment-grade, U.S. dollar-denominated, fixed-rate, taxable bond market. It is not possible to invest directly in an index. Past performance does not guarantee future results.
At some point, we feel it is reasonable to believe that longer-duration fixed income will perform well. Figuring out when that exact point will be is much harder to predict. By constructing a diversified fixed-income portfolio, the need to predict specific outcomes at precise times becomes less important. The credit/duration barbell may be an attractive solution for investors who want to build a more resilient portfolio without having to time markets perfectly. There is a case to be made for credit, given fundamentals, relatively high yields and low dollar prices. As Treasury yields rise, it becomes more apparent that high-quality duration makes sense as well. By pairing both credit and rate-sensitive fixed income in a credit/duration barbell, an investor can have a view on the economy and markets but also not need to depend on that view to be entirely correct to have a positive outcome.
Definitions
Standard deviation is a statistic that measures the dispersion of a dataset relative to its mean and is calculated as the square root of the variance.
Duration is a measure of the sensitivity of a fixed-income investment, such as a bond or a bond portfolio, to changes in interest rates.
Core Bonds are a category of fixed-income securities that form the foundation of a diversified bond portfolio. They typically consist of relatively stable and low-risk bonds and are fundamental to building a balanced investment portfolio.
Intermediate Core Bond, as a Morningstar category, encompasses mutual funds and ETFs that are primarily invested in intermediate-term core bonds. These funds typically focus on stable and low-risk bonds with intermediate maturities.
Intermediate-Core Plus Bond, as a Morningstar category, includes funds that invest in intermediate-term bonds. These funds may have a slightly different risk profile or strategy compared to pure core bond funds while still emphasizing stability and low risk.
Long Government, as a Morningstar category, consists of funds that primarily invest in long-term U.S. government bonds. These bonds are known for their safety and are considered low-risk investments.
Short-Term Bonds, as a Morningstar category, consist of funds that primarily invested in bonds with shorter maturities.
Bank Loans, as a Morningstar category, consist of funds that invest in floating-rate loans made by banks to corporations. These loans often have interest rates that adjust based on benchmark rates.
The Credit Duration Barbell is a portfolio strategy that combines credit exposure (typically non-investment-grade bonds) and duration (usually higher-quality, investment-grade bonds) to achieve diversification and manage risk. This strategy involves balancing the credit quality and maturity profile of bond investments.
The Bloomberg U.S. Aggregate Bond Index is a broad-based benchmark that measures the investment- grade, U.S. dollar-denominated, fixed-rate, taxable bond market, including Treasuries, government-related and corporate securities, mortgage-backed securities (agency fixed-rate and hybrid adjustable-rate mortgage pass-throughs), asset-backed securities, and commercial mortgage-backed securities.
The Morningstar LSTA U.S. Leveraged Loan Index is a broad index designed to reflect the performance of U.S. dollar facilities in the leveraged loan market. Index results assume the reinvestment of all capital gain and dividend distributions.
ICE BofA US High Yield BB-B (1-5Y) tracks the performance of U.S. dollar denominated below investment grade corporate debt publicly issued in the U.S. domestic market.
About risk
Past performance is no guarantee of future results, which will vary. All investments are subject to market risk and will fluctuate in value.
Treasury Securities are backed by the full faith and credit of the United States government as to payment of principal and interest if held to maturity. Interest income on these securities is exempt from state and local taxes.
Bonds are subject to interest-rate risk and can lose principal value when interest rates rise. Bonds are also subject to credit risk, in which the bond issuer may fail to pay interest and principal in a timely manner, or that negative perception of the issuer’s ability to make such payments may cause the price of that bond to decline.
Floating-rate funds are generally considered to have speculative characteristics that involve default risk of principal and interest, collateral impairment, non-diversification, borrower industry concentration, and limited liquidity.
Investing in below-investment-grade securities may carry a greater risk of nonpayment of interest or principal than higher-rated bonds. These securities can also be subject to greater price volatility. Diversification cannot assure a profit or protect against loss in a declining market.
Diversification cannot assure a profit or protect against loss in a declining market.
Important disclosures
This material contains the opinions of its authors but not necessarily those of New York Life Investments or its affiliates. It is distributed for informational purposes only and is not intended to constitute the giving of advice or the making of any recommendation to purchase a product. The opinions expressed herein are subject to change without notice. The investments or strategies presented are not appropriate for every investor and do not take into account the investment objectives or financial needs of particular investors.
This material represents an assessment of the market environment as at a specific date, is subject to change, and is not intended to be a forecast of future events or a guarantee of future results. This information should not be relied upon by the reader as research or investment advice regarding any funds or any particular issuer/ security.
Any forward-looking statements are based on a number of assumptions concerning future events, and although we believe the sources used are reliable, the information contained in these materials has not been independently verified, and Its accuracy is not guaranteed. In addition, there is no guarantee that market expectations will be achieved.
New York Life Investments and its affiliates do not provide tax advice. You should obtain advice specific to your circumstances from your own legal, accounting, and tax advisors.
This material contains general information only and does not take into account an individual’s financial circumstances. This information should not be relied upon as a primary basis for an investment decision. Rather, an assessment should be made as to whether the information is appropriate in individual circumstances and consideration should be given to talking to a financial professional before making an investment decision.
By subscribing you are consenting to receive personalized online advertisements from New York Life Investments.
